How we set up Prometheus & Grafana in less than 1 hour at Proximus
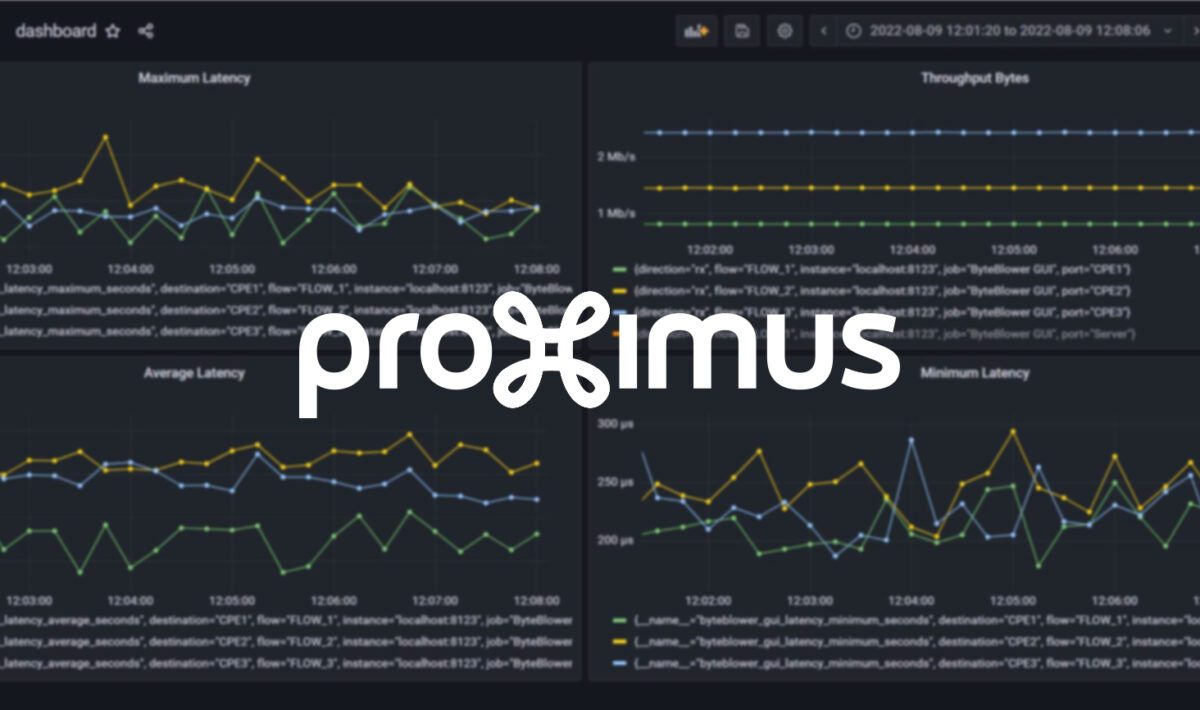
Proximus In-home Solutions Team:
Getting early and direct feedback of test runs using live dashboards has been on our planning here at Proximus. Excentis proposed real-time graphs using the Grafana observability platform in tandem with the Prometheus database. With support of the Excentis engineering team, we constructed an initial setup and successfully performed a first trial run in less than an hour!
Data can be sourced from multiple sources, even 3rd party sources using different data formats can easily be integrated, while Grafana allows for comprehensive real-time visualization and flexibility.
Real-time graphs through easy to use, flexible dashboards proved to be a powerful way to help us get a much better real-time understanding of the situation quickly, saving time and resulting in a better service and lower operational costs. We’re looking forward to the next releases which will include more results like live Wi-Fi stats from the wireless endpoints!
Thank you, fine people of Proximus In-Home Solutions Team for the great collaboration and kind words!
Real-time visualisation of network traffic using Prometheus and Grafana
The latest version of the ByteBlower GUI v2.18 has a great new feature that enables the exporting of time-series data and real-time visualization with dashboards. Enter Prometheus and Grafana!
Why use Prometheus & Grafana? Long Duration Tests
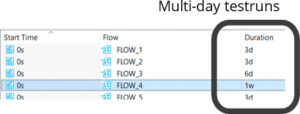
Tests over extended periods are important to demonstrate the robustness at the scale of whole networks. They reveal rare but high impact issues that can flood support-centers with angry customers.
Before v2.18, the ByteBlower GUI took the responsibility to save all over-time results. This places a limit on how large tests can grow before overloading the application. The Prometheus storage engine specializes in saving long runs of numerical results. This can be exported to Grafana to produce exciting and highly customizable dashboards.
Getting Started with Prometheus & Grafana
We will explain how you can set up Prometheus and Grafana on a local machine and have it target the GUI on the same machine. Prometheus and Grafana can be installed on a separate machine but this takes a little extra work. Multiple GUI’s can also be targeted by the same Prometheus instance or a single GUI towards multiple Prometheus instances. There are endless possibilities!
Local Machine
After some short configuration, you will be up and running with powerful dashboards.
Just follow these simple steps!
- Download the latest ByteBlower GUI v2.18 at https://setup.byteblower.com/software.html
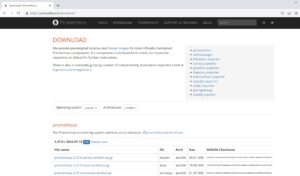
- Download Prometheus → https://prometheus.io/download/

- Go to “Downloads” and unzip the downloaded Prometheus file.
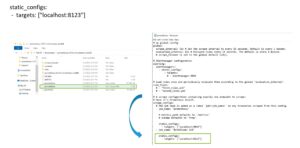
Open prometheus.yml file in a text editor, add lines (see below) at the bottom, save and close.
The .yml file allows the user to make config changes.
We configure the location of the GUI on your machine → TCP port 8123.
Can also change the scrape time here which is the time interval for collecting data from the GUI.
The default is 15 seconds which is sufficient for most cases.
- Start a test in the ByteBlower GUI with a longer duration e.g. 1 hour or more
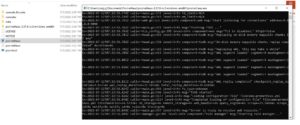
- Run the Prometheus.exe file → you should see an output like

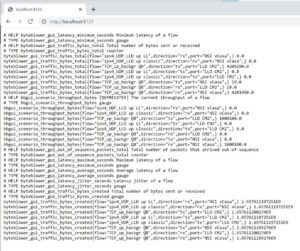
- Browse to localhost:8123 → You should see an output like this

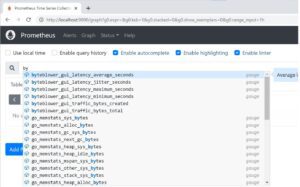
- Browse to localhost:9090 → Start typing ByteBlower → you should see a dropdown selection

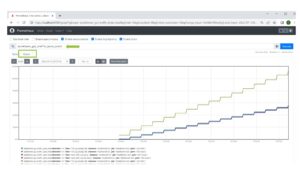
- Select a parameter of interest and hit the “graph” button → click and drag to zoom in

- Download Grafana at https://grafana.com/grafana/download?pg=get&plcmt=selfmanaged-box1-cta1
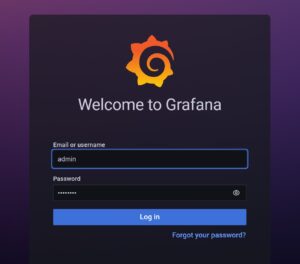
- Browse localhost:3000 → Username and password = admin/admin

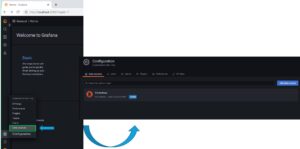
- Select data source as “Prometheus”

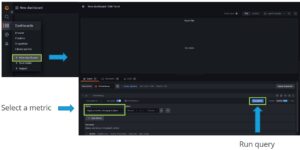
- Create your first dashboard

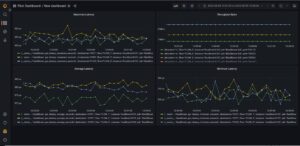
- Here is a nice example for latency and throughput

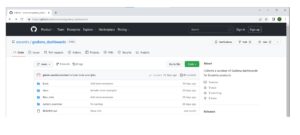
- Import example dashboards from Excentis GitHub → https://github.com/excentis/grafana_dashboards
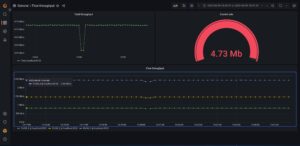
 Here’s one we made earlier!

The steps outlined above should help you get started and we have some example Grafana dashboards you can import from our GitHub pages!
You can read more about Prometheus for ByteBlower on our Knowledge Base here.
How can we help you?
Get early and direct feedback of test runs using powerful and easily configurable live dashboards!
Contact us and let’s get started.
