ByteBlower insights
How we set up Prometheus & Grafana in less than 1 hour at Proximus
Proximus In-home Solutions Team: Getting early and direct feedback of test runs using live dashboards has been on our planning here at Proximus. Excentis proposed real-time graphs using the Grafana observability platform in tandem with the Prometheus database. With support of the Excentis engineering team, we constructed an initial setup...
An easy dashboard for DOCSIS and network traffic
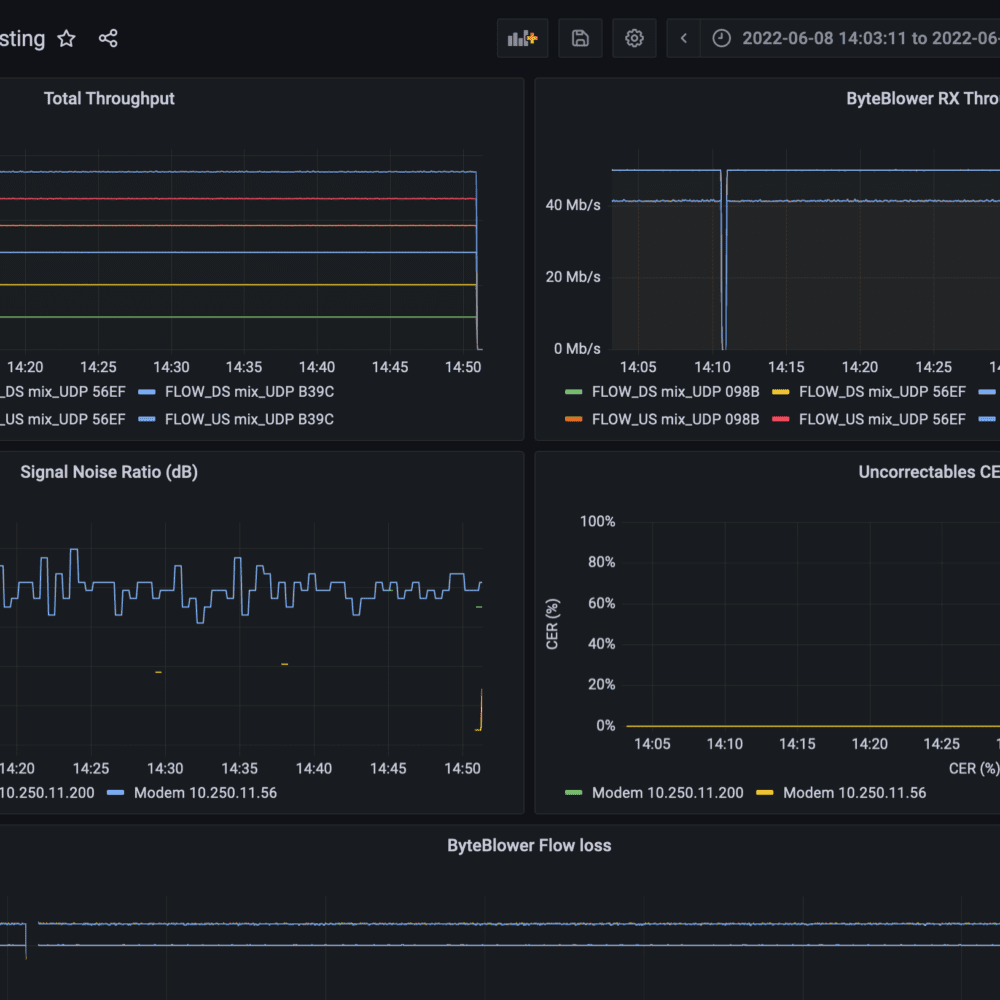
Have you ever noticed how a significant portion of your time is lost switching between different tools? Take a modem test, for example. The DOCSIS stats are found on one console-terminal, the traffic generator has a GUI, and probably a few more dashboards or admin panels. While each of these...
Is low latency the holy grail to fantastic user experience?

Experts agree that latency optimization is essential to improve today’s end-user experience. For a long time there wasn’t much emphasis on this aspect as latency was either not important for the application (e.g. downloading movies from the internet) or remedied through additional bandwidth. However, let’s be honest: we’ve all done...
TCP Half-Close: a cool feature that is now broken
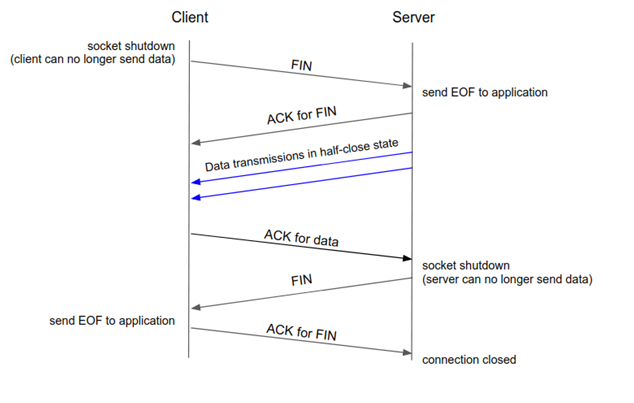
When we released a new version of the ByteBlower traffic generator a few years ago we started getting user reports saying the TCP traffic flows mysteriously “stopped” after a short time. Some users told us the traffic stopped after 10 to 30 seconds. Other users told us the TCP flows stopped immediately. For those users...
What happens if you introduce latency to a Remote PHY setup?
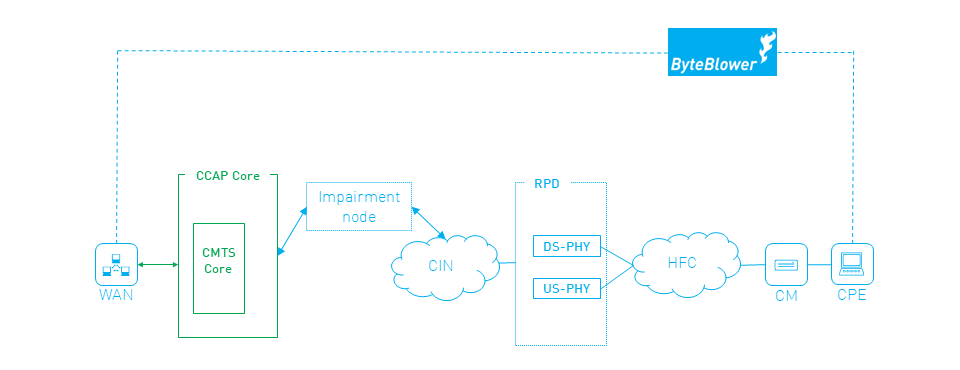
It’s been a while since we first explained how to use Linux Traffic Control as an impairment node to introduce latency to a test setup. More recently, the discussion surrounding Low Latency DOCSIS triggered us to investigate what would happen if we used an impairment node to introduce latency between the CCAP...
